
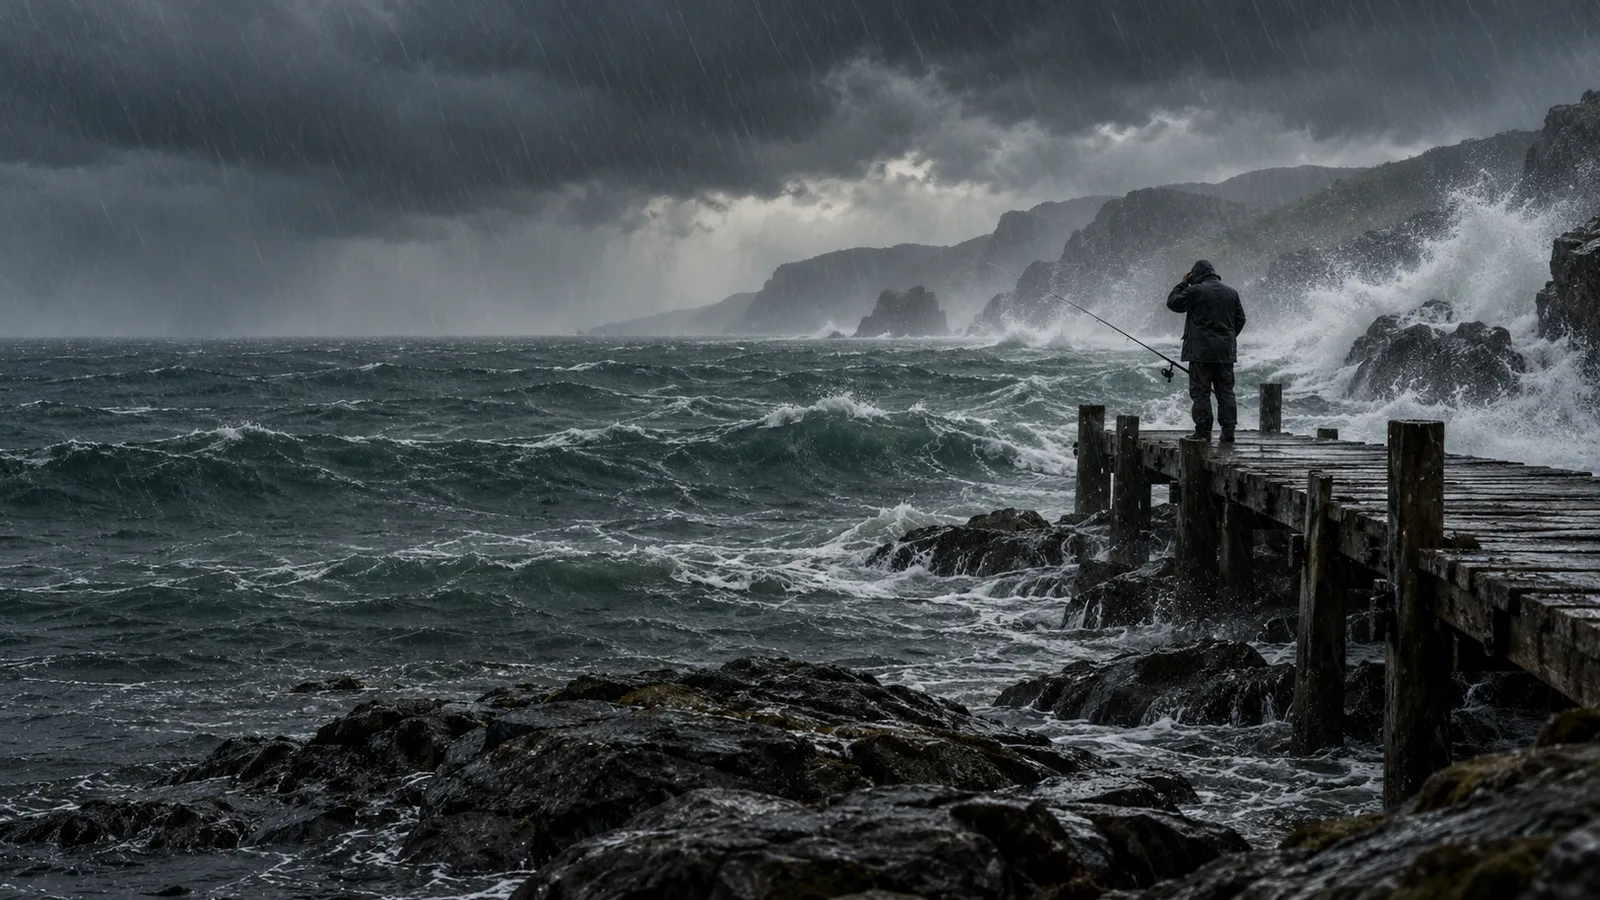
An atmospheric river is a long, narrow and transient band that carries a large amount of water vapour from warm oceans towards higher latitudes. It usually stretches ahead of the cold front of a large extratropical low-pressure system. When it hits coastal mountains, the air has to rise and cools, and the vapour turns into rain and snow.
01What it is
The river you cannot see from your window
An atmospheric river is not a cloud, nor is it a storm in its own right. The water vapour it carries is an invisible gas, and only the clouds and precipitation that form from it show up in the sky. Meteorologists place it within the wider system of extratropical low-pressure systems that carry heat and moisture from the tropics towards the poles.
The band, however, does not flow high up. Most of the water vapour in it lies in the lowest three kilometres or so of the atmosphere, below the level where air pressure falls to 700 hectopascals. It is driven along by a low-level jet, a ribbon of the strongest wind, whose core aircraft measured about a kilometre above sea level.
The edge of the band is determined by calculation. Meteorologists track integrated vapour transport, or IVT for short. It gives how many kilograms of vapour per second pass through an imaginary vertical wall one metre wide, reaching from the Earth's surface up to the height where the air pressure falls to 300 hectopascals. Where IVT drops below 250 kilograms of vapour per second per metre of band width (kg m−1 s−1), the atmospheric river ends.

02Scale
How much water a river in the sky carries
According to NOAA, the average atmospheric river carries as much water vapour as the Mississippi pours into the sea, and some carry up to fifteen times more. According to NASA, atmospheric rivers are the largest mechanism for transporting fresh water on Earth, and according to the American Meteorological Society they are the largest freshwater rivers of all.
All of this water travels through the air as vapour. It reaches the ground only when the air rises, cools and the vapour condenses into rain or snow. Where and how intensely that happens decides whether the river brings useful water or a flood.
03Formation
Why the band forms and where it heads
- 01
The warm ocean evaporates
In the tropics the heat of the sun evaporates large amounts of water and the air becomes saturated with moisture.
- 02
Wind carries vapour towards the pole
Strong wind in the lower layers ahead of a cold front drives moist air from warm regions towards higher latitudes in a narrow band.
- 03
Mountains force the air to rise
On coastal mountains the wind blows up the slope, the air cools and the vapour condenses.
- 04
Vapour turns into rain and snow
Where the air is forced to rise, heavy precipitation falls, at higher elevations in the form of snow.
Mountains are not the only place where the vapour precipitates out. It also rains heavily where a warm conveyor belt, that is a stream of warm, moist air rising at a slant ahead of a cold front, lifts the air upwards. Besides moisture and strong wind near the ground, the formation of the river is helped by moist air with neutral stratification, which does not hinder the rising of air.

04Around the world
From Hawaii through California to Antarctica
Atmospheric rivers do not belong only to the Northern Hemisphere. They form over the North Pacific and Atlantic, the southeastern Pacific and the South Atlantic, and often make landfall on the west coasts of North and South America. They also reach land in Greenland, in Antarctica and in the south-central part of the USA.
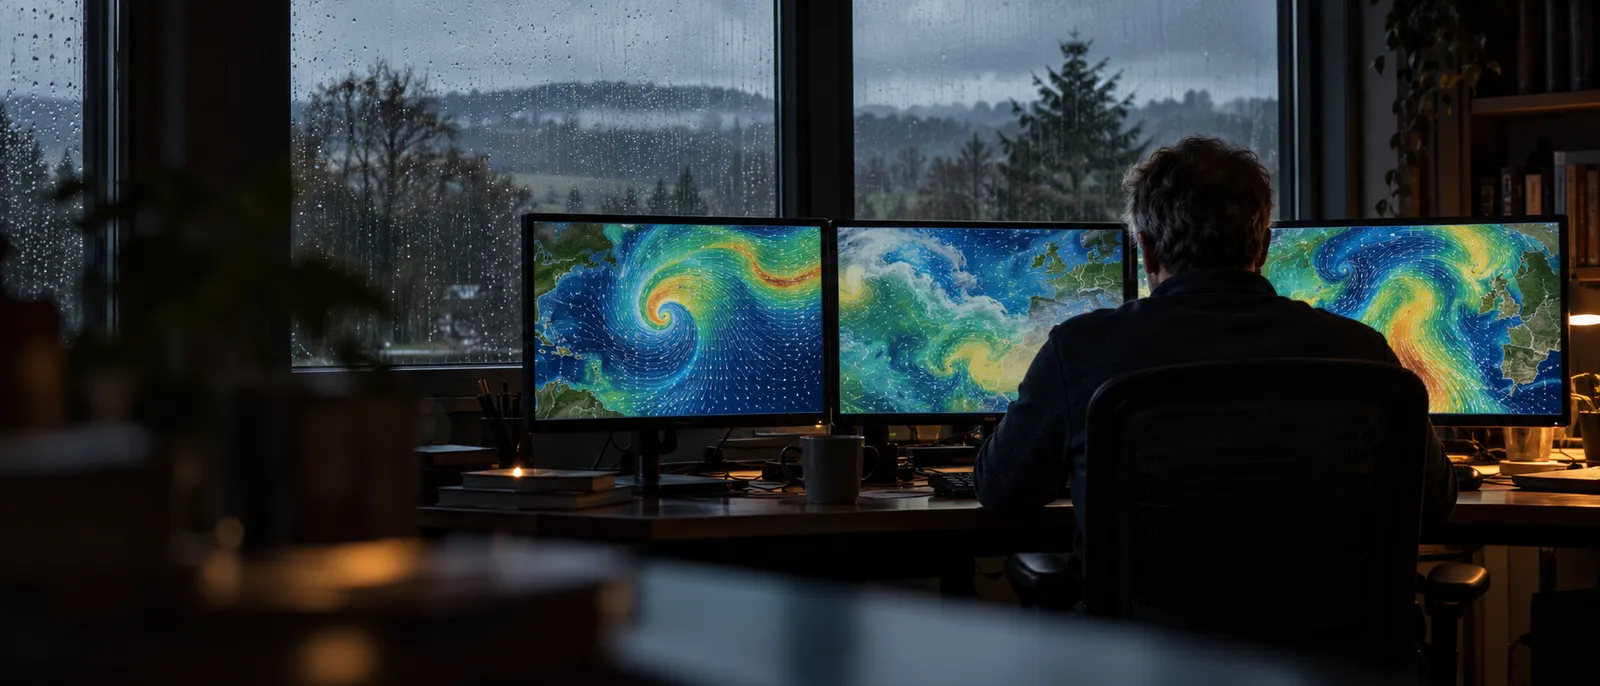
The concept is surprisingly young. The American Meteorological Society formally defined it only in 2017. According to the CW3E centre in 2019, scientists have studied atmospheric rivers in depth for only the last twenty years, building on older research on cyclones, mainly in Great Britain.
05Gift and threat
A gift and a threat for California and Europe
Atmospheric rivers have two faces. Many of them are weak and bring mainly useful water. A strong river, however, can deposit so much precipitation in a short time that it causes floods and mudflows.
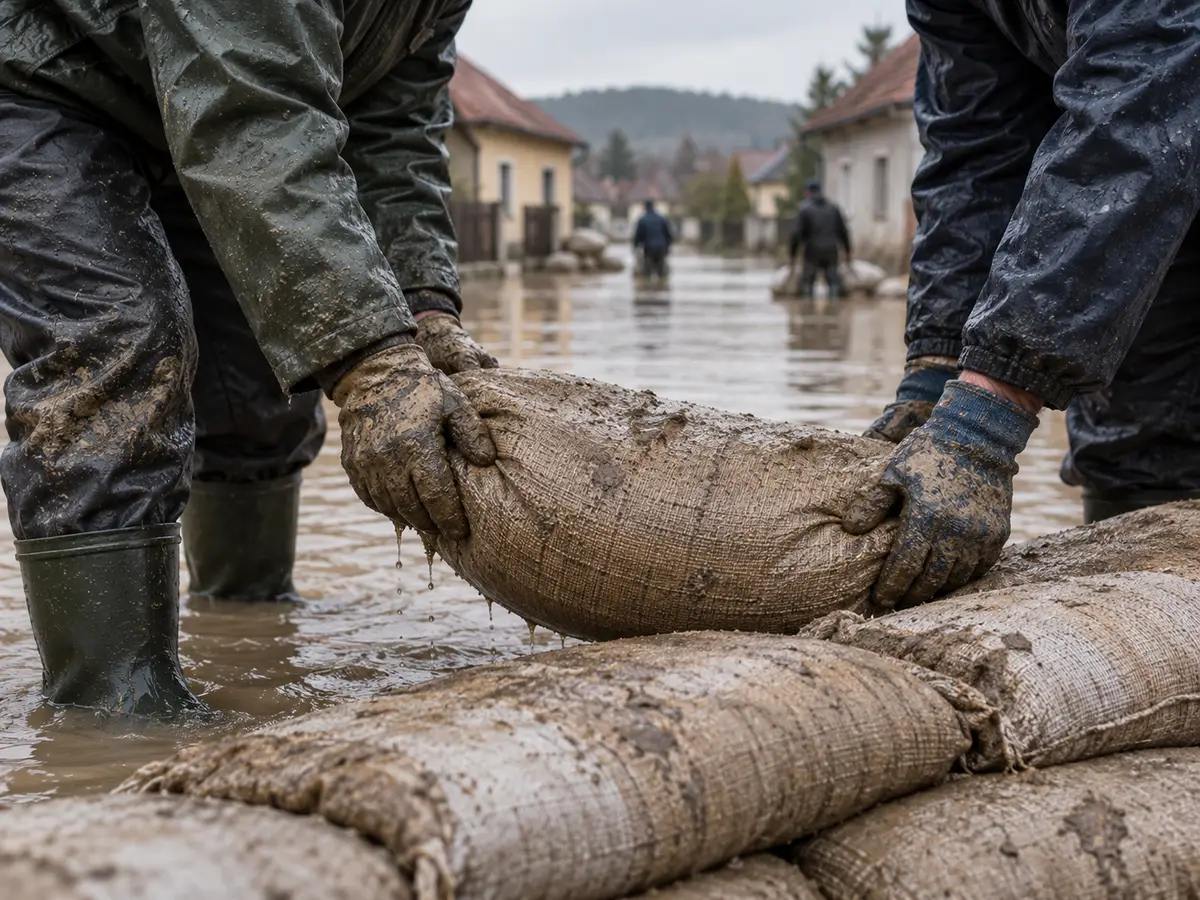
The river of the turn of 1996 and 1997 lingered off the coast of central California from 29 December to 2 January, over 100 hours in all. Duration matters a great deal, because the impact of an atmospheric river is decided mainly by the strength of the vapour flow and the time it lasts.
How quickly California can swing from dry to wet was shown by the winter of 2022 to 2023. After record dry spells in 2012 to 2016 and 2020 to 2022, nine atmospheric rivers struck the west coast of the USA between 27 December 2022 and 17 January 2023. The series had the longest continuous run of days with an atmospheric river since 1950.

Western Europe knows rivers as strong as those of the western USA
A 2021 study by Eiras-Barca and colleagues, which mapped atmospheric rivers over Europe for the years 1980 to 2019, found that the most common maximum IVT values in western Europe are about 100 kg m−1 s−1 higher than on the west coast of the USA. Extreme and exceptional rivers with IVT above 1000 kg m−1 s−1 occur in both regions with similar frequency.
In Europe the most common rivers are those of the first and second level of the five-level scale. They bring most of the observed precipitation, but only rarely extreme rain. Levels 3 to 5 are much rarer, but with them extreme rain arrives with high probability.
06Forecast
How it is measured and forecast
Atmospheric rivers are monitored by several instruments at once. Polar-orbiting satellites, which circle the Earth over the poles, use microwave sensors to measure the total amount of water vapour in the atmosphere. Ground observatories measure water vapour, the snow level and wind at various heights, and reconnaissance aircraft add to the observations.
Satellite data help the American weather service issue warnings of heavy rain and floods often five to seven days ahead. In just five years, the CW3E centre at the Scripps Institution of Oceanography, together with the California Department of Water Resources, has also extended the lead time of atmospheric river forecasts by a whole day.
According to CW3E, further improvement depends on how well scientists understand what determines the direction, timing, duration and strength of the river's impact on land. These details matter for where and how much it finally rains.
A scale from 1 to 5 was created to assess strength in a way that is easy to understand. It was put together by F. Martin Ralph, director of the CW3E centre, with Jonathan Rutz of the American weather service and other experts. A stronger river becomes dangerous mainly where it hits, for example, ground scorched by wildfires or soil already soaked with water.
| Level | Label | Maximum IVT |
|---|---|---|
| AR1 | Weak | from 250 |
| AR2 | Moderate | from 500 |
| AR3 | Strong | from 750 |
| AR4 | Extreme | from 1000 |
| AR5 | Exceptional | from 1250 |
07Map
Radar shows where it is raining right now
Weather radar picks up the drops and flakes that are already falling. It cannot see water vapour itself, so an atmospheric river is revealed only by the precipitation it brings onto land. Radars, together with rain gauges, are also used by scientists studying what atmospheric rivers cause on the ground.
Precipitation and radar mapSee where it is raining near you right now and where the band of precipitation is moving.Open the precipitation mapSources10 sources · every number and claim in the article comes from them
- NOAA NESDIS
- NOAA National Ocean Service
- NASA Earthdata
- American Meteorological Society (Glossary of Meteorology)
- EUMeTrain
- Ralph, Neiman, Rotunno 2005, Monthly Weather Review
- CW3E, Scripps Institution of Oceanography
- CW3E, Scripps Institution of Oceanography
- USGS (Ralph a kol., 2019, BAMS) (Ralph et al., 2019, BAMS) (in Czech)
- CW3E (publikace Eiras-Barca a kol., 2021) (publication by Eiras-Barca et al., 2021) (in Czech)