
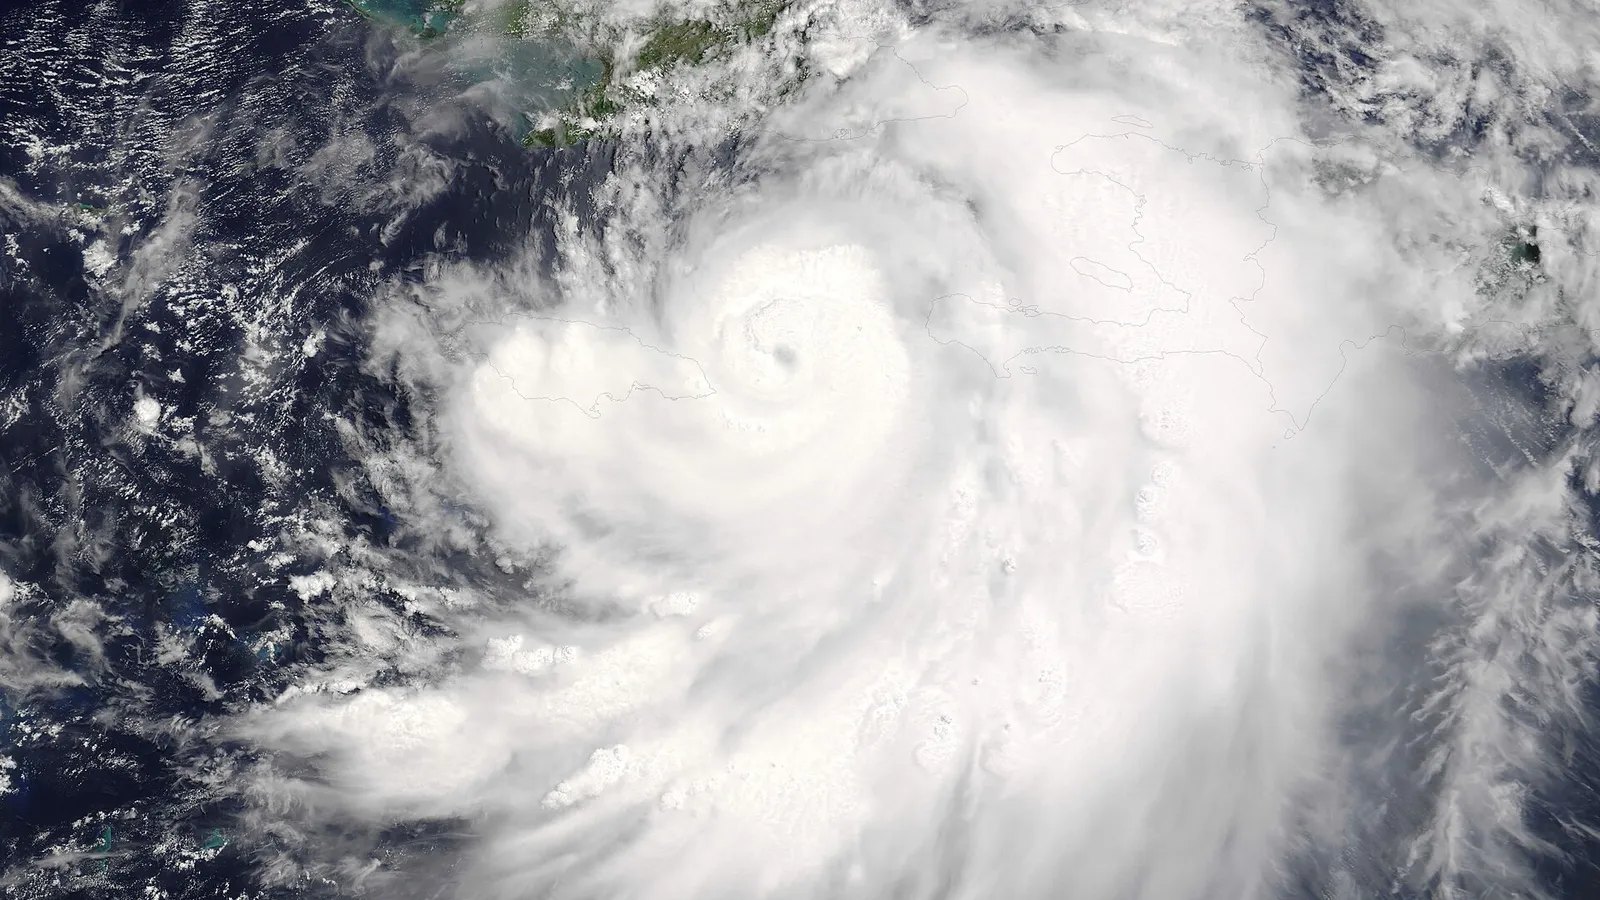

In numbers
105mph
Sustained wind of Hurricane Isaias at landfall near Destin in Florida
over +4.0°C
Sea surface temperature anomaly in parts of the eastern equatorial Pacific
872mb
Lowest recorded pressure in the Western Hemisphere, Hurricane Patricia 2015
over 83%
Chance of a strong to very strong El Niño until January to March 2027
On both sides of the Americas, hurricanes are behaving this year as if they belonged to two different worlds. The eastern Pacific is racking up one major hurricane after another, while the Atlantic waited until October for its first hurricane. The mechanism behind it is well known, though. It is called El Niño, and this year it is strong to very strong.
01Two oceans
Two neighbouring oceans, two opposite fates
The NHC summary as of 17 October shows the difference in numbers. The eastern Pacific has 19 named storms, 9 hurricanes and 7 major hurricanes, five storms and four major hurricanes more than the 1991 to 2020 normal. The Atlantic has only 9 storms and a single hurricane, and its ACE, the accumulated energy of the season, is 83% below normal.
That the two oceans behave in opposite ways may not be a coincidence. El Niño, which often gives storms in the eastern Pacific more energy, usually strengthens wind shear in the Atlantic and makes it harder for budding storms to organise into a hurricane.
| Region | Storms, hurricanes, major hurricanes | ACE against the 1991 to 2020 normal | NOAA outlook |
|---|---|---|---|
| Eastern Pacific | Storms, hurricanes, major hurricanes: 19, 9 and 7 | ACE against the 1991 to 2020 normal: 230.6, 128% higher | NOAA outlook: May, 15 to 22 storms, 9 to 14 hurricanes, 5 to 9 major |
| Atlantic | Storms, hurricanes, major hurricanes: 9, 1 and 1 | ACE against the 1991 to 2020 normal: 18.0, 83% lower | NOAA outlook: August, 7 to 13 storms, 2 to 6 hurricanes, 0 to 2 major |
02Storm names
Hurricane, typhoon or cyclone? And who gives them their names
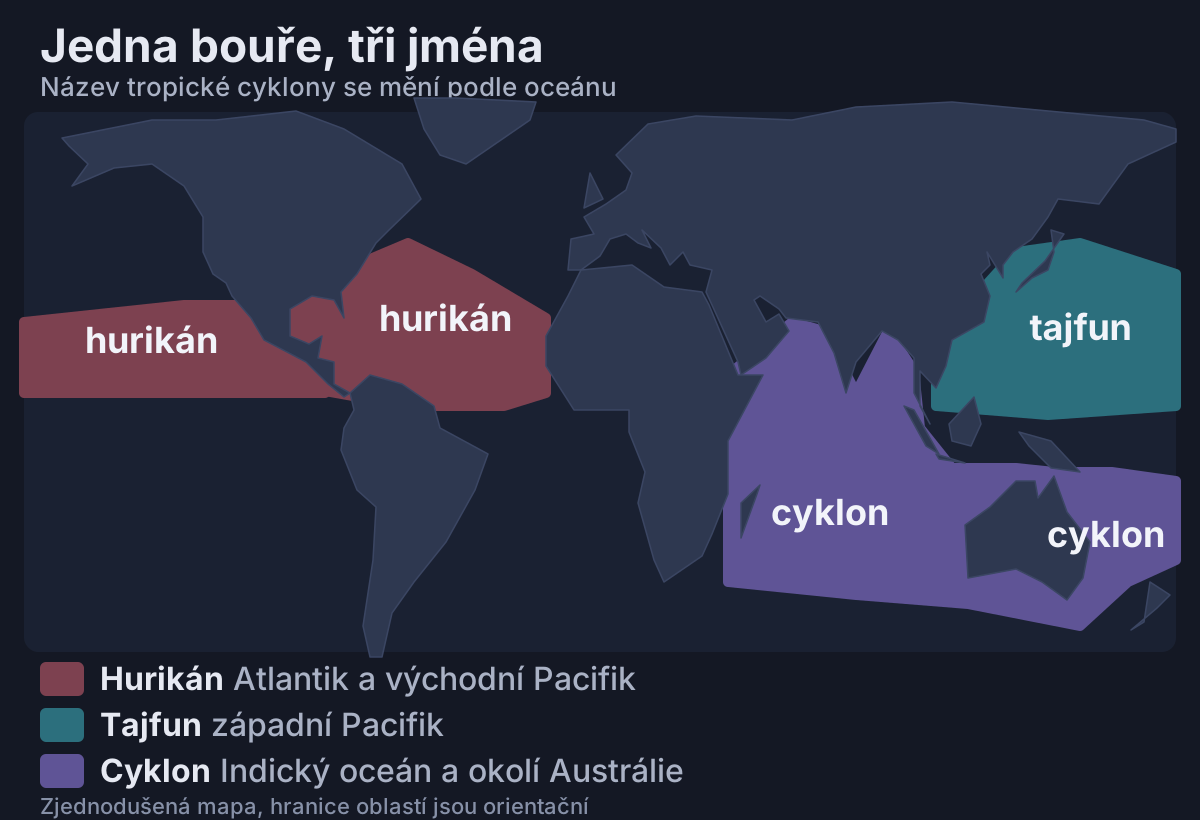
Hurricane, typhoon and cyclone are one and the same phenomenon, a tropical cyclone, just with a different name depending on the ocean. In the Atlantic and the eastern Pacific it is called a hurricane, in the western Pacific a typhoon, and in the Indian Ocean or near Australia a cyclone.
According to the NHC, a tropical storm has sustained wind from 34 knots and becomes a hurricane from 64 knots, that is 74 mph or 119 km/h. A knot is a nautical unit of speed, about 1.85 km/h. The Saffir–Simpson scale then sorts hurricanes into five categories, but it rates only wind, not storm surge, flooding from rain or tornadoes.
| Category | Sustained wind in mph | Sustained wind in km/h |
|---|---|---|
| 1 | 74 to 95 | 119 to 153 |
| 2 | 96 to 110 | 154 to 177 |
| 3 (major hurricane) | 111 to 129 | 178 to 208 |
| 4 (major hurricane) | 130 to 156 | 209 to 251 |
| 5 (major hurricane) | 157 or more | 252 or more |
Hurricanes of category 3 and higher, that is from 96 knots, are called major. In the western Pacific, storms with sustained wind above 150 mph, roughly 240 km/h, are called super typhoons.
Names are not invented by television stations or by the meteorologists of individual countries, the lists are compiled by the World Meteorological Organization (WMO). The Atlantic lists rotate and repeat after six years. The name of an especially destructive storm can be retired at the request of a member state, and in 2021 Dorian, Laura, Eta and Iota disappeared this way.
In place of Laura, the 2026 Atlantic list has Leah. Isaias in the Atlantic and Simon in the eastern Pacific also come from this year's lists.
The Atlantic list uses only 21 letters, because it is hard to find six suitable names for Q, U, X, Y and Z. When the names ran out, the Greek alphabet used to be used, most recently in 2020 with 30 named storms, nine of which bore a Greek name. Since 2021 it has been replaced by a supplemental list, because the Greek letters distracted from the warnings and could cause confusion.
03Season strength
The strength of a season is not counted in pieces
The strength of a season is described not just by the number of storms but by the ACE index. It combines the strength and duration of all named storms and hurricanes, so one long, powerful hurricane can weigh more than several short storms that quickly fell apart.
The NHC calculates ACE by taking, every six hours, the highest sustained wind of each named storm in knots, squaring it and adding up the results. Because the speed is squared, one strong hurricane adds far more than a weak storm.
That is why a season can set an ACE record without a record number of storms. According to calculations by Colorado State University (CSU) for the northeast Pacific, including its central portion, ACE reached 318.8 on 11 October, surpassing the record of 318.1 set in 2018. An average year produces about 132.7.
The NHC summary for the eastern Pacific alone, as of 17 October, gives an ACE of 230.6, or 128% above the 1991 to 2020 average. The figure is lower because the NHC counts only that basin, while CSU also includes the central Pacific. The two summaries also come from different days.
It was Hurricane Simon that pushed the season past the CSU record. According to The Weather Network, it brought western Mexico wind at the upper end of category 4 and torrential rain. The NHC gives its peak as 135 knots, about 250 km/h, and a pressure of 928 mb, and it was active from 7 to 16 October.
Almost half of this year's ACE, according to The Weather Network, came from just three storms, Polo, Lowell and Nolo. Genevieve, Lowell and Polo reached category 5, and Polo had, according to the NHC, 155 knots at its peak, about 287 km/h, and a pressure of 892 mb.
A strong season was to be expected. The May NOAA outlook anticipated ACE at 120 to 190 per cent of the median, and in El Niño years the eastern Pacific has on average about 30 more ACE points than in La Niña years.
04Atlantic
A calmer Atlantic, and yet a strike on Florida
September is normally the peak of the Atlantic season, with activity usually culminating around 10 September. This year, however, the Atlantic reached 21 September with six named storms and not a single hurricane, which according to WCAX had not happened in 112 years.
The first hurricane did not arrive until October. According to NOAA, Isaias strengthened into a hurricane on 7 October at around 22.30 CDT. The NHC’s morning advisory on 8 October was already reporting sustained winds of around 80 mph, about 130 km/h. It was the Atlantic’s latest first hurricane since at least 1905.
Before this year, the latest first hurricanes of the satellite era, which began in 1966, formed on 11 September, in 2002 and 2013. Since 1851, the Atlantic has had only two entire seasons without a hurricane, in 1907 and 1914.
According to the NHC, Isaias made landfall near Destin, Florida, at around 20:30 local time with sustained wind of 105 mph, that is 165 km/h, and an estimated pressure in the eye of 971 mb. At landfall that corresponds to category 2 on the Saffir–Simpson scale. The NHC seasonal table, however, lists it at its peak as a major hurricane with 105 knots, about 194 km/h, and a pressure of 959 mb, so watch the units.

Wind is not everything, though. The tide gauge at Panama City Beach showed water 5.6 feet, about 1.7 metres, above the average height of the higher of the two daily high tides, which roughly corresponds to the depth of flooding at that spot. Near Santa Rosa Sound, a wind gust of 116 mph was measured with sustained wind of 91 mph.
A calmer season therefore does not mean a safe one. A single hurricane or tropical storm is enough to cause a disaster, even in a year with low overall activity.
05El Niño
A common culprit called El Niño
During El Niño the surface of the equatorial Pacific warms above normal. This year the anomalies are extraordinary, exceeding +4.0 °C in parts of the eastern equatorial Pacific.
According to the NOAA Climate Prediction Center (CPC), El Niño is still strengthening and will stay strong to very strong until January to March 2027 with a chance of over 83 per cent. The chance that it surpasses all events since 1950 is 54 per cent for September to November and 83 per cent for October to December.
In the eastern and central Pacific, El Niño often increases hurricane activity, because warmer water gives them more energy and conditions for storm formation are more favourable. The May NOAA outlook also expected below-normal wind shear over the central tropical Pacific, which historically means more storms.
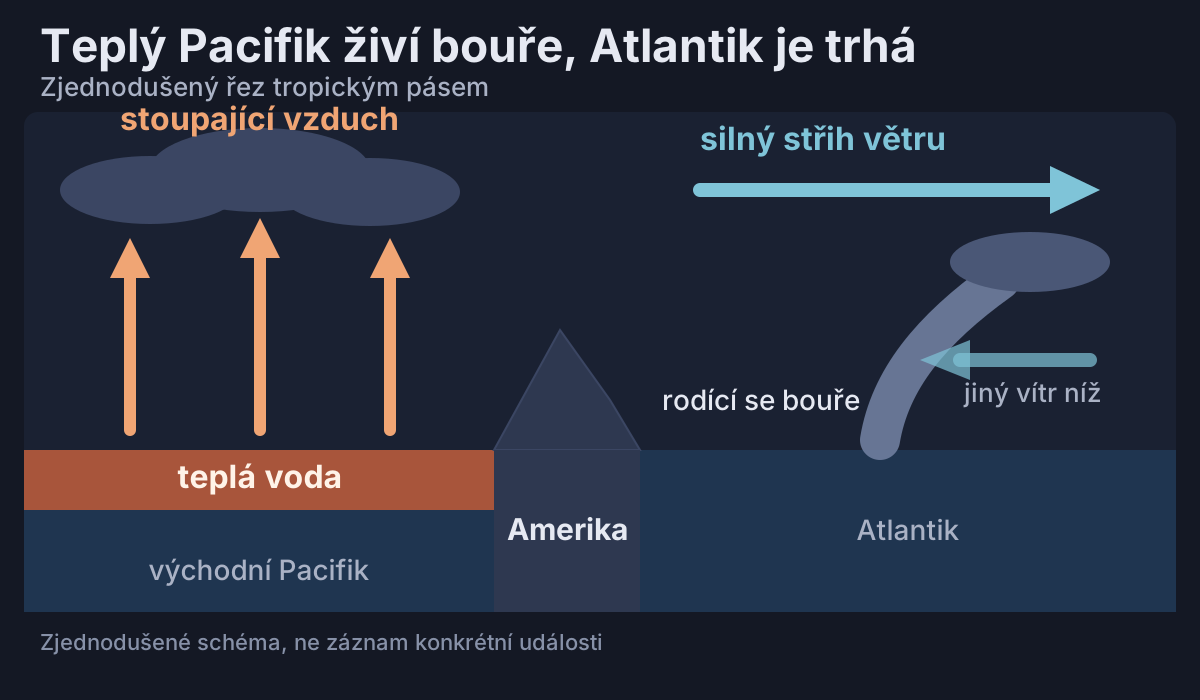
In the Atlantic, El Niño generally strengthens vertical wind shear, the difference between the wind at the surface and aloft, which blows a budding storm apart before it can organise into a hurricane. Its influence tends to be clearest in the later part of the season, from September to November.
According to NOAA, the Atlantic Multidecadal Oscillation also helps explain the opposite relationship between the activity of the two oceans. We do not yet have verified measured shear values for this August and September, so we describe the mechanism and not the numbers. How El Niño develops further, we follow in a separate article about the super El Niño.
06Typhoons
Meanwhile a super typhoon raged in the western Pacific
Typhoon Sinlaku intensified into a super typhoon in April northwest of the island of Chuuk, and on 12 April it maintained sustained wind of 175 mph, about 280 km/h. A record-long extreme wind warning applied to Tinian and Saipan, and 12 deaths are linked to the storm.
We do not yet have a verified overall tally for this year's typhoon season and will add it from official data. The influence of El Niño cannot be read from a single storm, even an extraordinary one.
07Limits
What is certain and what we do not yet know
According to NOAA CPC, El Niño is strong this year and is forecast to strengthen further by the end of the year. It is also well established that this phenomenon often strengthens storms in the eastern Pacific and usually suppresses them in the Atlantic.
The Atlantic and eastern Pacific seasons officially run until 30 November, so more hurricanes may still develop. The provisional ACE record of 318.8 applies to the northeast Pacific, including its central portion, as of 11 October, according to CSU’s calculations. NOAA will issue its next El Niño report on 12 November 2026.
NOAA flagged a quiet Atlantic as early as August. Its outlook gave a 75% chance of a below-normal season and expected 7 to 13 named storms, 2 to 6 hurricanes and at most 2 major ones. Every season since 1950 that coincided with a strong El Niño, after all, had below-normal activity.
| What we know | What we do not yet know |
|---|---|
| El Niño is strong and, according to NOAA CPC, still strengthening | What we do not yet know: How strong it will finally be and whether it will reach historic strength |
| El Niño often boosts the Pacific and usually dampens the Atlantic | What we do not yet know: How many storms the remaining weeks of the season will bring |
| Isaias became the Atlantic’s latest first hurricane since at least 1905 and made landfall as a category 2 hurricane | What we do not yet know: How the final NHC reports will rate Isaias and the whole season |
| According to CSU’s calculations, the northeast Pacific, including its central portion, had a record ACE of 318.8 on 11 October | What we do not yet know: What the final ACE will be once the season is over |
| Both seasons officially end on 30 November | What we do not yet know: Whether the tally for the two oceans will still change by then |
08Did you know
Did you know that hurricanes…


Sources21 sources · specific figures come from the sources, the general explanation from expert knowledge
- NOAA CPC (US National Oceanic and Atmospheric Administration, Climate Prediction Center)
- NOAA AOML (US National Oceanic and Atmospheric Administration, Atlantic Oceanographic and Meteorological Laboratory)
- NOAA CPC (US National Oceanic and Atmospheric Administration, Climate Prediction Center)
- NOAA NHC (US National Oceanic and Atmospheric Administration, National Hurricane Center)
- NOAA NHC (US National Oceanic and Atmospheric Administration, National Hurricane Center)
- NOAA NHC
- NOAA NESDISGOES East monitors Hurricane Isaias (8 October 2026)
- NOAA NHC
- NOAA NHC
- NOAA CPC
- NOAA NHC (US National Oceanic and Atmospheric Administration, National Hurricane Center)
- WMO (World Meteorological Organization)
- WMO (World Meteorological Organization)
- WMO (World Meteorological Organization)
- The Weather Network (CSU data)
- CSUReal-Time Northeast Pacific Ocean Statistics
- WCAX
- WBTV
- NWS Guam (US National Weather Service, Guam office)
- NASA Earthdata (NASA Earthdata)
- NOAA OMAO (US National Oceanic and Atmospheric Administration, Office of Marine and Aviation Operations)