

In numbers
3.11°C
Daily Niño 3.4 anomaly on 21 September 2026, with a previous record of 3.08 °C
83%
October outlook for the chance that RONI for October to December would reach at least +2.5 °C
about1.7°C
July estimate of warming in 2027 above pre-industrial levels
The daily sea surface temperature anomaly in the Niño 3.4 region reached 3.11 °C on 21 September, surpassing the 3.08 °C recorded on 18 November 2015. The average water temperature itself then reached a September record of 29.70 °C. These are two different measures of the same exceptional developments in the equatorial Pacific.
01The basics
When the wind weakens, the ocean warms
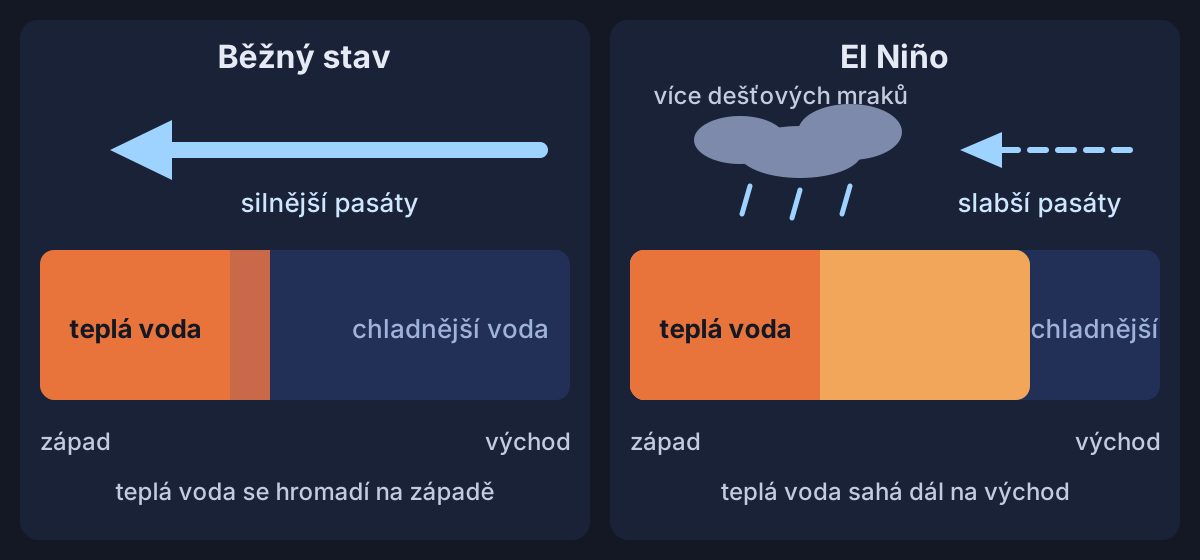
In the tropics, the trade winds blow from east to west. Under normal conditions, they push warm surface water ahead of them, piling it up in the western Pacific near Indonesia.
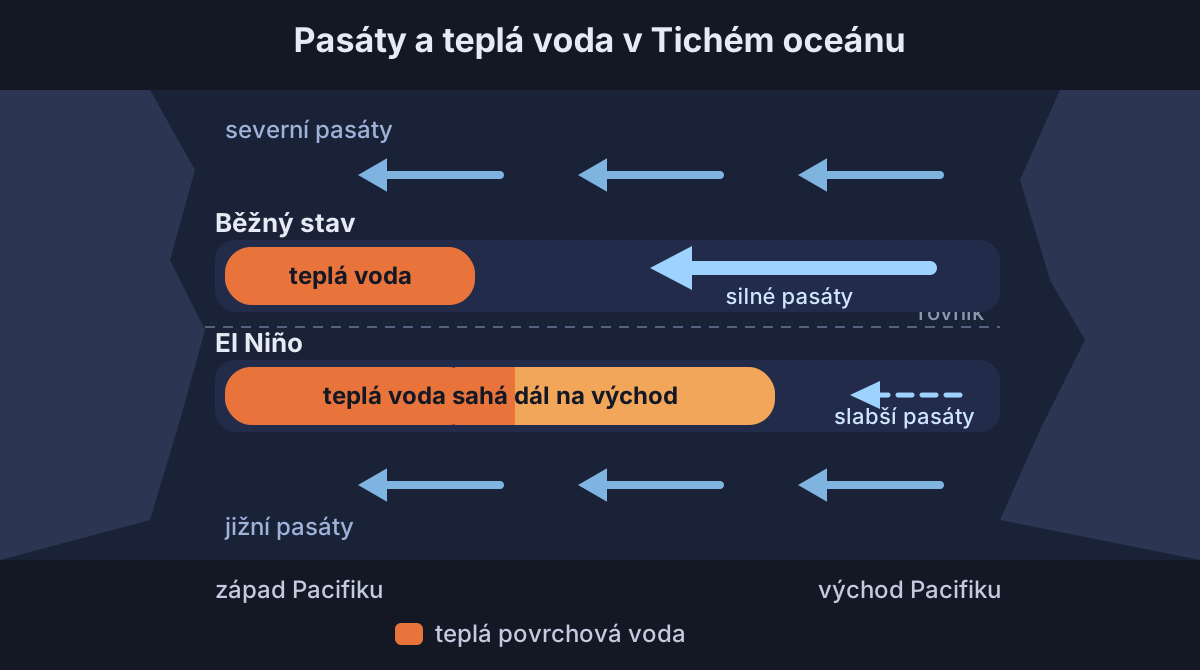
During El Niño, the trade winds weaken and sometimes even reverse. Warmer surface water then extends further east, and the rain follows it into the central and eastern Pacific.
The process reinforces itself. Weaker winds allow the ocean surface to warm, and the warmer sea weakens the winds further. The ocean also releases heat into the atmosphere, temporarily raising global temperatures and changing rainfall patterns.
02Names
The Christ Child and the little girl
Peruvian fishermen gave the name El Niño, meaning the Christ Child, to a warm current that appeared off the coast around Christmas. Later, the name came to refer only to irregular, strong events that recur every 2 to 7 years.

The opposite, cold phase is called La Niña, meaning the little girl. During this phase, the trade winds strengthen, the central and eastern tropical Pacific cools, and Australia and Indonesia typically receive more rain. Between the two phases lies a neutral state.
03Measurement
Records depend on how you measure them
The equatorial Pacific is divided into several monitoring regions. El Niño is assessed mainly using the Niño 3.4 region in the central to eastern Pacific, where sea surface temperatures are compared with the long-term average.
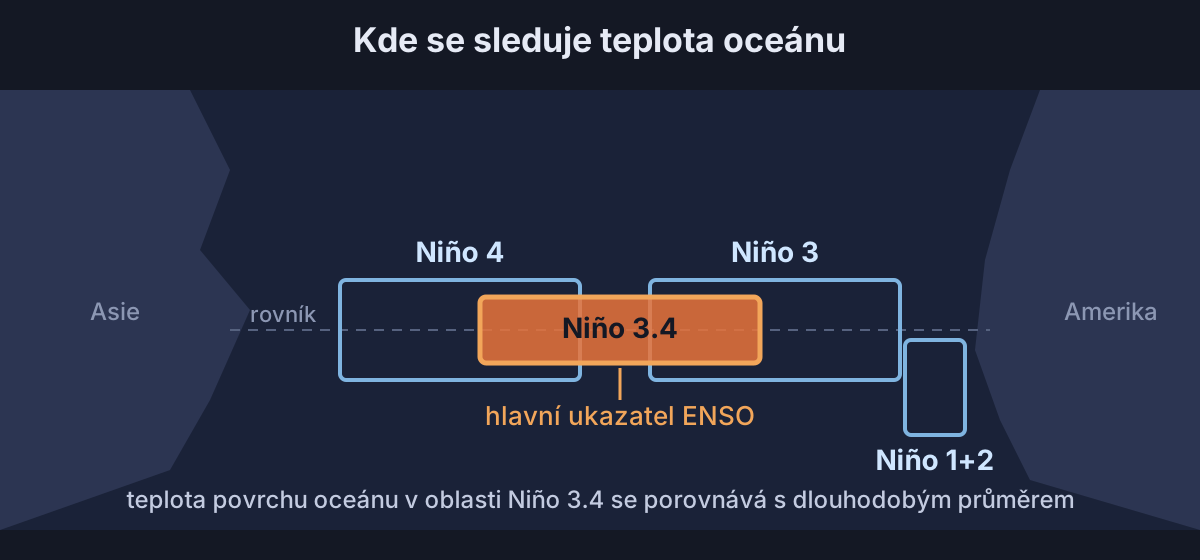
NOAA traditionally used a three-month rolling average of the anomaly, known as ONI. A value of +0.5 °C or higher indicates El Niño. An event is classed as strong from +1.5 °C and very strong from +2 °C, earning it the nickname super El Niño.
This year's El Niño began in April and was already strong by June. In September, the water in the Niño 3.4 region averaged 29.70 °C, warmer than at the peaks of the major El Niño events of 1982–83, 1997–98 and 2015–16.
The entire tropical ocean has warmed, however, so in February 2026 NOAA switched to the relative index RONI for assessing and forecasting El Niño. It compares the Niño 3.4 region with the average across the entire tropical ocean, separating El Niño from the broader warming of the tropics.
In mid-September, the daily relative anomaly was around 2.5 °C, about 0.7 °C below the December 1982 record. The conventional daily anomaly, meanwhile, had already surpassed the 2015 record.
04Outlook
How high could El Niño climb?
In September, the World Meteorological Organization expected an average anomaly of around 3.6 °C for September to November, with a peak in November and December. A Carbon Brief analysis using 14 modelling systems showed a monthly peak of around 4.1 °C, with all 674 runs exceeding the 2015–16 record.
NOAA's October outlook gave an 83% chance that the three-month relative index RONI for October to December would reach at least +2.5 °C. Such a value would make this year's episode exceptionally strong compared with events since 1950.
The models have never had an event this strong against which to test their forecasts. The 674 runs therefore show agreement between models, rather than a certain outcome. August observations also came in about 0.3 °C below their forecasts.
05Global temperature
The hottest year may not arrive until 2027
El Niño releases heat from the ocean into the atmosphere, temporarily raising the temperature of the whole planet. Carbon Brief expected the current episode to have its greatest impact in 2027.
According to Copernicus, September 2026 was 1.63 °C warmer than the pre-industrial average. Outside the polar regions, the oceans recorded a September average of 21.05 °C, a record for the month. The run of months above the 1.5 °C threshold that began in August is expected to continue into 2027.
Whether 2026 itself will set a record remains uncertain. In an analysis published on 24 July, Carbon Brief estimated a 35 % chance of a new record.
For 2027, the same July analysis estimated warming of around 1.71 °C above pre-industrial levels and a 92% chance of a new record. The current record year, 2024, averaged 1.52 °C across 6 major datasets.
06Impacts
Droughts and downpours around the world
Warm water draws the rain eastwards. El Niño typically brings flooding to Peru and drought to Indonesia and Australia. In the Atlantic, it generally increases wind shear, which limits the development of tropical storms into hurricanes.
These outcomes are not guaranteed, however. The stronger El Niño becomes, the more likely its typical impacts are, but the strength of the ocean anomaly alone cannot determine their extent in a particular place.
07Czechia
What will winter bring to Czechia?
The Copernicus seasonal outlook issued on 10 October considered above-average temperatures and rainfall more likely across most of Europe. Researchers at the University of Reading found that long-range forecasts of European winters can be somewhat more reliable during a strong El Niño, but they are still uncertain.
In the mid-latitudes, El Niño's impacts are less consistent and can be overridden by other climate influences. It therefore cannot reliably tell us whether winter in Czechia will be mild or freezing. For the next few days, it is worth checking the forecast for your location.
Your local forecastFind out what weather to expect where you are over the next few days.View forecast08On the side
Iguanas shrink and days grow longer


A strong El Niño also lengthens the day very slightly. The 1982–83 episode added about 0.9 milliseconds, while the 2015–16 event produced a change of 0.81 milliseconds in January 2016.
Sources17 sources · every number and claim in the article comes from them
- Carbon Brief, 21. 9. 2026 (aktualizace 23. 9.) (21. 9. 2026, updated 23. 9.)
- Carbon Brief
- University of Reading
- NOAA CPC
- Copernicus C3S
- NASA Earth Observatory (citace M. McPhadena, NOAA PMEL) (Quotation from M. McPhaden, NOAA PMEL)
- NOAA Climate.gov
- NOAA Climate.gov
- NOAA PMEL, What is El Niño
- NOAA (text přetištěný v blogu Making Science Public) (Text reprinted on the Making Science Public blog)
- NOAA Climate Prediction Center
- WMO Global Seasonal Climate Update
- NOAA AOML, ENSO FAQ
- WMO
- Copernicus C3S
- University of Illinois (o studii Wikelski a Thom, Nature, 2000) (On the study by Wikelski and Thom, Nature, 2000)
- Earth System Dynamics